
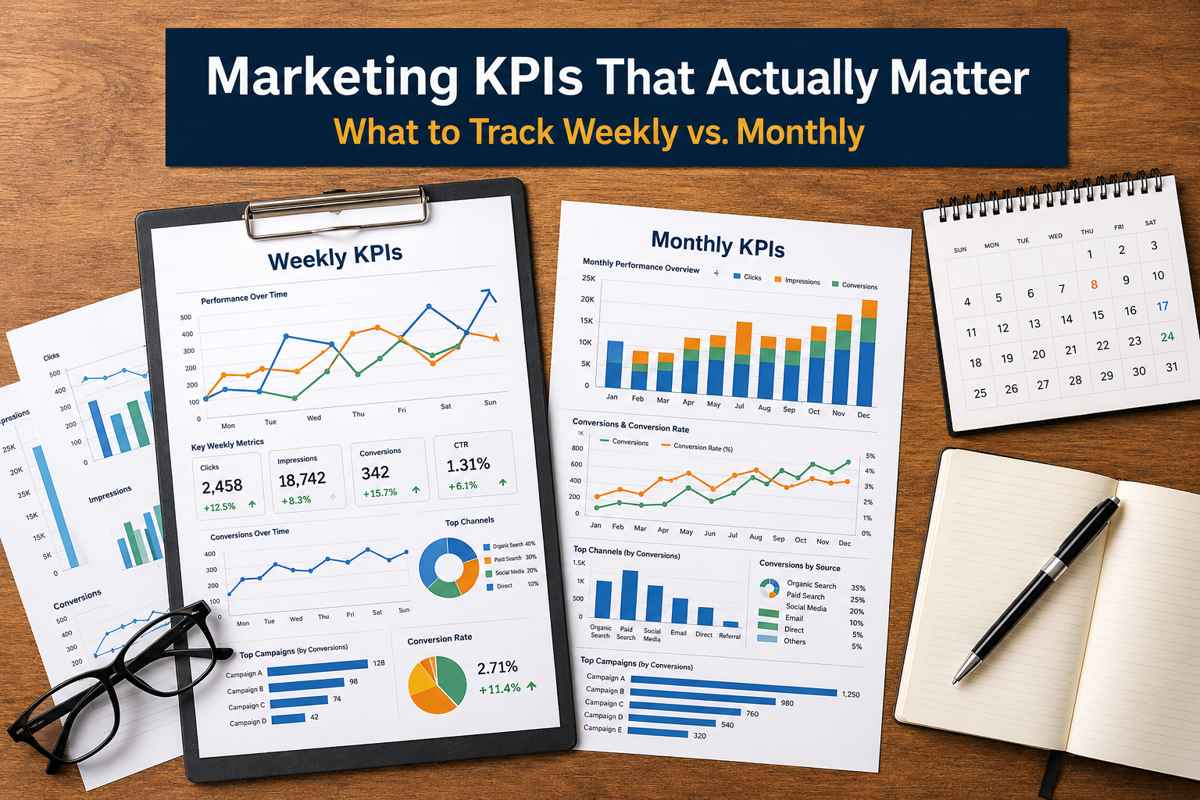
Marketing KPIs That Actually Matter: What to Track Weekly vs. Monthly
There is no shortage of marketing data. Between ad platforms, website analytics, CRM dashboards, email reports, and social metrics, most businesses have access to more numbers than ever before. The challenge is not getting data. The challenge is knowing which marketing KPIs actually matter.
Too often, teams either track too much or focus on the wrong things. They end up buried in dashboards full of impressions, clicks, opens, and engagement rates without a clear understanding of whether marketing is helping the business grow. That is where a better reporting rhythm helps.
Not every metric needs the same level of attention. Some should be reviewed weekly so your team can react quickly. Others make more sense on a monthly basis when there is enough data to spot trends and make higher-level decisions. When you separate weekly KPIs from monthly KPIs, reporting becomes more useful and less overwhelming.
What makes a KPI actually matter?
A useful KPI helps your team make decisions. It should tell you something meaningful about performance, quality, efficiency, or progress toward a business goal. A metric matters when it helps answer questions like these:
- Are we attracting the right audience?
- Are we converting attention into action?
- Are leads improving in quality?
- Are our campaigns becoming more efficient over time?
- Is marketing contributing to revenue or pipeline?
A metric may still be interesting without being important. For example, social reach or website traffic might be worth monitoring, but those numbers alone do not prove business impact. The key is to track performance in context.
What to track weekly
Weekly KPIs are best for operational visibility. These are the numbers that help you spot issues early, adjust campaigns faster, and keep momentum moving in the right direction.
- Lead volume is one of the most useful weekly KPIs. It gives you a quick pulse on whether campaigns, offers, and channels are producing response. If lead flow suddenly drops, that could point to a tracking issue, a budget problem, a platform issue, or weaker campaign performance.
- Conversion rate is another strong weekly number. This could refer to landing page conversion rate, form completion rate, click-to-lead rate, or another meaningful conversion point in your funnel. Watching this weekly helps you catch friction quickly.
- Cost per lead is especially useful if you are running paid campaigns. It helps you understand efficiency at the top and middle of the funnel. A rising cost per lead may signal creative fatigue, poor targeting, or a mismatch between message and audience.
- Traffic by channel is helpful when viewed with intent. You do not need to obsess over every traffic fluctuation, but a weekly look can reveal whether key sources like organic search, paid search, direct traffic, email, or referral traffic are trending up or down.
- Engagement on active campaigns can matter weekly too, especially when you are testing ad creative, email sends, or content promotions. Here, engagement is not the end goal, but it can be an early signal of message strength.
- Sales follow-up speed or lead response time can also be valuable in businesses where speed-to-lead affects conversion. Marketing performance does not end when a lead comes in. If follow-up slows down, results often suffer.
The goal of weekly reporting is not to overanalyze every small movement. It is to catch meaningful changes fast enough to do something about them.
What to track monthly
Monthly KPIs are better for trend analysis, strategic evaluation, and broader performance review. By the end of a month, you usually have enough data to make more confident judgments.
- Qualified leads should be reviewed monthly in most cases. Weekly qualified lead numbers can be noisy, especially if sales review takes time. Monthly reporting gives a clearer picture of lead quality and whether marketing is attracting the right prospects.
- Cost per qualified lead is often more meaningful than cost per lead. A campaign can generate cheap leads that never become real opportunities. Monthly review helps connect spend to actual quality.
- Pipeline contribution is one of the most important monthly KPIs for many businesses. This measures how much pipeline marketing is helping generate or influence. It moves the conversation beyond activity into revenue potential.
- Customer acquisition cost can also be reviewed monthly, especially when marketing and sales work closely together. This KPI helps businesses understand whether growth is becoming more efficient or more expensive.
- Close rate from marketing-generated leads is another powerful monthly number. It helps answer whether marketing is simply filling the funnel or actually supporting sales with better opportunities.
- Return on ad spend may matter monthly for businesses with direct-response campaigns, although it should be interpreted carefully. In longer sales cycles, immediate return can be misleading, so it may need to be paired with pipeline or opportunity metrics.
- Organic growth metrics such as rankings, non-branded traffic growth, or content-driven conversions are usually better reviewed monthly. SEO and content marketing often move gradually, so monthly trend analysis is far more useful than weekly fluctuations.
- Email performance trends can also be more meaningful monthly, especially when comparing themes, lists, campaigns, and conversion contribution over time.
Weekly versus monthly: the real difference
Weekly reporting helps with optimization. Monthly reporting helps with decision-making.
When you review weekly KPIs, you are asking questions like: What needs attention right now? What changed? What should we adjust this week? When you review monthly KPIs, you are asking: Are we improving? Which channels are contributing most? What patterns are emerging? Where should we invest more or less?
Both matter. A business that only reviews monthly data may react too slowly. A business that only looks weekly may stay stuck in short-term thinking.
Avoid vanity metrics without ignoring context
Vanity metrics are numbers that look positive but do not clearly connect to business outcomes. That does not mean they are always useless. Impressions, reach, follower growth, and open rates can still offer clues. The problem comes when they become the headline of the report.
For example, a campaign that produces high engagement but low conversion may have a messaging or audience problem. A blog post with lower traffic but strong lead generation may be more valuable than a high-traffic article with no action. Context matters more than volume alone.
The best reports keep supporting metrics in the background and put business-relevant KPIs at the center.
Build a simple reporting system
A strong KPI system does not have to be complicated. Start by grouping your metrics into three layers: visibility, conversion, and business impact.
Visibility metrics include traffic, reach, impressions, and clicks.
Conversion metrics include form fills, conversion rate, cost per lead, and lead response.
Business impact metrics include qualified leads, pipeline contribution, close rate, and customer acquisition cost.
This structure helps teams understand how marketing performance flows from attention to action to revenue.
Final Thoughts
Marketing KPIs only matter if they help your team make smarter decisions. That is why it is important to separate what should be monitored weekly from what should be reviewed monthly. Weekly metrics help you stay responsive. Monthly metrics help you stay strategic.
The best reporting systems are not built to impress people with data. They are built to create clarity. When you focus on KPIs that reflect both performance and business impact, your marketing becomes easier to measure, improve, and trust.